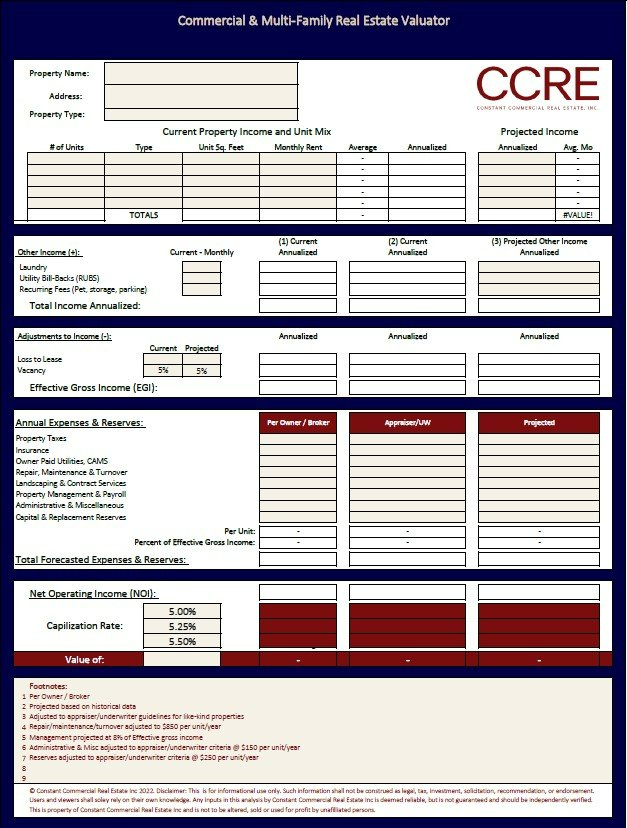
Here is an empty Real Estate Valuation analysis. The template requires inputs in the tan cells and features options to change the operating expenses to reflect the income and expenses being underwritten. For example, the left column may be the years financials annualized, middle is adjusted to the advisor/appraiser/underwriters criteria and the right projected following asset stabilization.
Get in touch
555-555-5555
info@constantcommercial.com

CCRE's Multifamily Underwriting Process
March 11, 2023
Introduction to CCRE's Proprietary Analysis used for Underwriting
Constant Commercial Real Estate takes an analytical and calculated approach to investment real estate underwriting. We believe in adhering to investment fundamentals and looking beyond the surface level of an opportunity by taking a deep dive into the numbers. Our clients get an under the hood view of our process. In this article we will outline the CCRE’s client experience by illustrating the technology and commonly used proprietary analysis tools to underwrite income producing real estate.
As a CCRE client you will share access with our Advisors to a Google Team Drive where all documents from our engagement will be stored. The Team Drives file structure is usually split into the different engagements types we have. This can include Commercial Financing, Property Underwriting (currently owned or acquisitions), listing documents and transactions files. This file structure allows security of private files (like tax returns) and other members of an investment team limited access. The Team Drive also allows live-time analysis updating and property forecasting. Clients can comment their questions or suggestions and we can work together in a collaborative way.
Each analyzed property will get its own folder containing the due diligence documents available to the broker. This usually includes a current rent roll, offering memorandum, profit and loss statements, photos and our proprietary analysis tools.
For each property CCRE underwrites, we provide two proprietary analysis tools. First we start with the Real Estate Valuator (REV) to determine a range of value for the investment using the income approach. The second analysis is the Property Analysis and Return Projections (PARP) to determine yield and model the performance of the investment adding the variability of debt.
- Real Estate Valuator (REV): This tool uses the income approach to determine the current value of an investment. The income approach is one of the three valuation methods and allows investors to estimate the value based on the income the property generates. The income approach is a function of the properties income minus the operating expenses to determine the net operating income (NOI). A capitalization rate is applied to the NOI. Capitalization rates are determined based on comparable sales of similar like-kind properties. For example, 10-20 unit buildings in B neighborhoods built in the 1970’s may have a current market capitalization rate of 6%. CAP rates are a metric used before/excluding debt. Determining capitalization rates requires access to data, experience and should be assessed by a professional. Example: Subject property earns $120,000 in annual income. Total annual expenses excluding debt is $42,000. This provides the Net Operating Income (NOI) of $78,000. Properties similar to this example sell at CAP rates near 6%. Net Operating Income of $78,000 with a 6% Capitalization rate equals a property value of $1,300,000 ($78,(503)222-0282 = $1,300,000).
- Property Analysis and Return Projections (PARP): This analysis inputs include income, expenses and factors the variability of debt in years 1, 3, 5 and 7. It takes into consideration principal pay down, tax effects (depreciation, interest expense and investors effective tax rate), annual increases in income & expenses and returns on hte invested capital/equity. This analysis has several utilities allowing the advisor to underwrite prospective acquisitions, currently owned properties and modeling projected returns following a refinance. Many of the major return metrics analyzed are:
- Pre-tax Cash Flow
- After-tax Cash Flow
- After-tax Cash Flow + Principal Pay Down
- After-tax Cash Flow + Principal Pay Down + Appreciation-x% = Total Return
- Capitalization rate, Gross Rent Multiplier and Debt Calculations for proceeding Years 3, 5 & 7
The underwriting process is more of an art than an exact science. Advisors must draw conclusions on adjusting income and expenses from marketing material and provided operating statements. Marketing material often generalizes and could overstate income and make light of the expense load. For buildings with upside and requiring turns, operating expenses may run higher than the provided operating statements. Properties that recently underwent large capital expenditures that are deflating the profit and loss statements in the short term must be adjusted to realize an actual expense load reflected during the hold period. Each property tells its own story and while underwriting may be maneuverable based on the investors goals and capabilities.
Constant Commercial Real Estate Inc takes pride in advising on your investment real estate journey. By taking a conservative approach to underwriting, keeping financing front of mind and staying involved between the buy/sell moment we are your trusted investment real estate specialists.
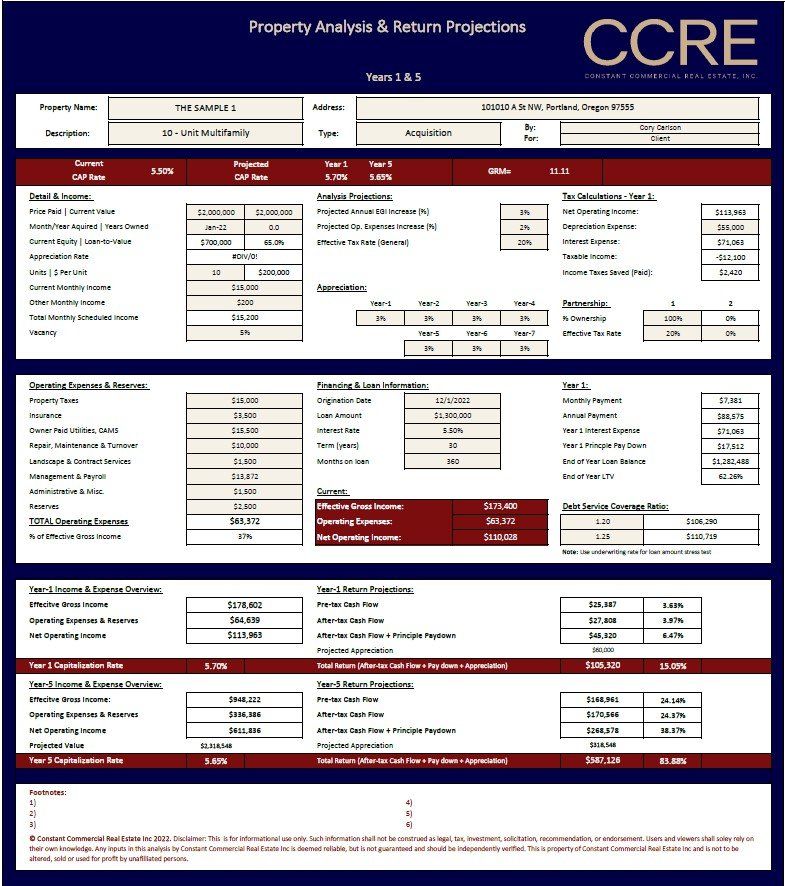
This 10-Unit Property Analysis & Return Projections (PARP) requires inputs in the tan cells. Generally the middle column "appraiser/underwriter" criteria is translated from the REV analysis featuring a more realistic expense load. The PARP has the ability to forecast and model the properties hold period for new aquisitions and currently owned properties. For current held properties it can calculate the principal pay down from the loans origination which can be adjusted to reflect a refinance scenario.

Maximizing Profits with Constant Commercial Real Estate’s List-Back Services

Delaware Statutory Trusts (DSTs) have gained significant popularity among real estate investors, particularly those looking to defer capital gains taxes while maintaining passive income from real estate holdings. A DST is a legal entity that allows multiple investors to own fractional interests in high-quality, institutional-grade properties. It provides a hands-off approach to real estate investment while offering potential tax advantages under the IRS 1031 Exchange guidelines. This article will explore the profile of an ideal DST investor, the tax treatment of these investments, a step-by-step guide on how to execute a DST exchange, and the critical role of an experienced real estate broker in facilitating the transaction. Who Should Consider a Delaware Statutory Trust? DSTs are not a one-size-fits-all investment. They are best suited for a specific type of investor, typically those who: Are Nearing Retirement or Seeking Passive Income: Investors who want to step away from active property management but still earn rental income find DSTs an attractive option. Have Highly Appreciated Investment Properties: Those looking to sell a property that has appreciated significantly and want to defer capital gains taxes through a 1031 Exchange. Seek Portfolio Diversification: DSTs offer access to diversified, professionally managed commercial properties, including multifamily apartments, medical offices, retail centers, and industrial facilities. Want to Avoid the Hassles of Property Management: DSTs eliminate the burden of dealing with tenants, repairs, and ongoing property oversight. Are Looking for Predictable Income: Many DSTs offer stable, projected distributions, making them an appealing choice for income-focused investors. Have a Low Risk Tolerance for Real Estate Investments: Institutional-grade properties with professional management often provide a more secure, stable investment compared to direct ownership of real estate. Tax Treatment of DSTs One of the main attractions of investing in a DST is the ability to defer capital gains taxes via a 1031 Exchange. Here’s how DSTs are treated from a tax perspective: 1031 Exchange Eligibility: The IRS recognizes DST interests as “like-kind” property, meaning investors can exchange their real estate holdings into a DST without triggering immediate tax liability. Tax Deferral: By utilizing a 1031 Exchange, investors can defer capital gains, depreciation recapture, and state taxes on the sale of a relinquished property. Potential for Step-Up in Basis: Upon the investor’s passing, heirs can receive a step-up in basis, potentially eliminating deferred taxes altogether. Depreciation Benefits: Investors receive depreciation pass-through benefits, which can offset taxable income from distributions. Passive Income Taxation: Income generated from the DST is reported on Schedule E, and depreciation deductions may help reduce taxable income. How to Execute a DST 1031 Exchange A 1031 Exchange into a DST follows a structured process. Below is a step-by-step guide: Step 1: Sell the Relinquished Property The first step is to sell the property that you intend to exchange. The sale proceeds must be handled by a Qualified Intermediary (QI) to maintain 1031 Exchange compliance. Do NOT list the real estate until you have FIRST communicated with a QI. Step 2: Identify the DST Investment Within 45 days of selling the relinquished property, you must identify potential replacement properties. Investors typically work with a an experienced real estate broker specializing in DSTs and 1031 exchanges to review available options. Step 3: Conduct Due Diligence Before committing to a DST investment, it’s crucial to analyze: The quality and location of the underlying real estate. The financial strength and reputation of the DST sponsor. The projected income and risk factors. The loan structure, if any. Step 4: Work with a Qualified Intermediary (QI) The QI facilitates the transaction, ensuring the funds are properly transferred and that all IRS regulations are met. The investor never takes possession of the sales proceeds directly from the relinquished properties. A QI needs to be involved early in the engagement to ensure title and escrow is set up to remain compliant. Step 5: Close on the DST Investment Once the due diligence is complete and the paperwork is finalized, the investor formally acquires a fractional interest in the DST property. The transaction must be completed within 180 days from the sale of the relinquished real estate. Constant Commercial Real Estate can assist in multiple property dispositions if it pertains. Step 6: Receive Passive Income and Tax Benefits After the exchange is finalized, the investor begins receiving distributions, typically on a monthly or quarterly basis. They also continue to defer taxes as long as they remain invested in the DST. Why an Experienced Real Estate Broker is Essential A real estate broker with experience in DSTs plays a vital role in ensuring a smooth and successful exchange. Here’s why their expertise matters: Navigating the Complexity of 1031 Exchanges: A broker familiar with 1031 rules helps investors avoid costly mistakes that could disqualify their tax deferral benefits. Access to Institutional-Quality DST Offerings: Brokers have relationships with reputable DST sponsors, giving investors access to high-quality properties not easily found on the open market. Objective Investment Guidance: An experienced broker helps evaluate DST options, considering factors such as market trends, sponsor track record, and risk assessment. Tailored Investment Strategy: Brokers work with investors to align their DST choices with long-term financial goals, ensuring a suitable fit for their portfolio. Streamlining the Identification Process: Given the strict 45-day identification window, a broker can expedite the selection process, helping investors make informed decisions under time constraints. Compliance with IRS Regulations: Working with a knowledgeable broker reduces the risk of missteps that could jeopardize the exchange. Conclusion Delaware Statutory Trusts provide a compelling investment vehicle for real estate owners seeking tax deferral, passive income, and diversification. However, executing a 1031 Exchange into a DST requires careful planning, thorough due diligence, and strict adherence to IRS rules. For investors looking to transition from active property management to a passive investment structure while preserving wealth, DSTs can be an excellent solution. Engaging an experienced real estate broker is key to identifying quality DST opportunities, navigating the 1031 Exchange process, and ensuring compliance with all regulatory requirements. With the right guidance, investors can leverage DSTs to optimize their real estate portfolios while enjoying long-term financial benefits.